Handling Missing Data: When to Use Mean, Median, Mode, or Just Drop It
Simran Sareen | July 3, 2025
There are several ways to handle missing data in your tables. I’m not going to cover them all here. If you want a deep dive, check out this comprehensive guide.
In this post, I’ll walk through the intuition behind:
- When it makes sense to impute with the mean, median, or mode
- When it’s better to drop missing rows altogether
Note: The figures I have here are just some small examples for visualization.
1. Meet the “holes” in your data
Imagine each row in your table is a seat at a dinner table. Ideally, every seat has a guest (a value). But life happens, maybe you lost a questionnaire or a sensor blinked off. Now you’ve got empty chairs. If you leave them unaddressed, downstream tools choke on “NaN.” So we either:
- Guess who should sit there (impute)
- Ask them to leave (drop the row)
- Get creative with advanced patchwork
Which approach depends on why the seat was empty and what kind of party you’re running.
2. Mean imputation: the polite dinner party
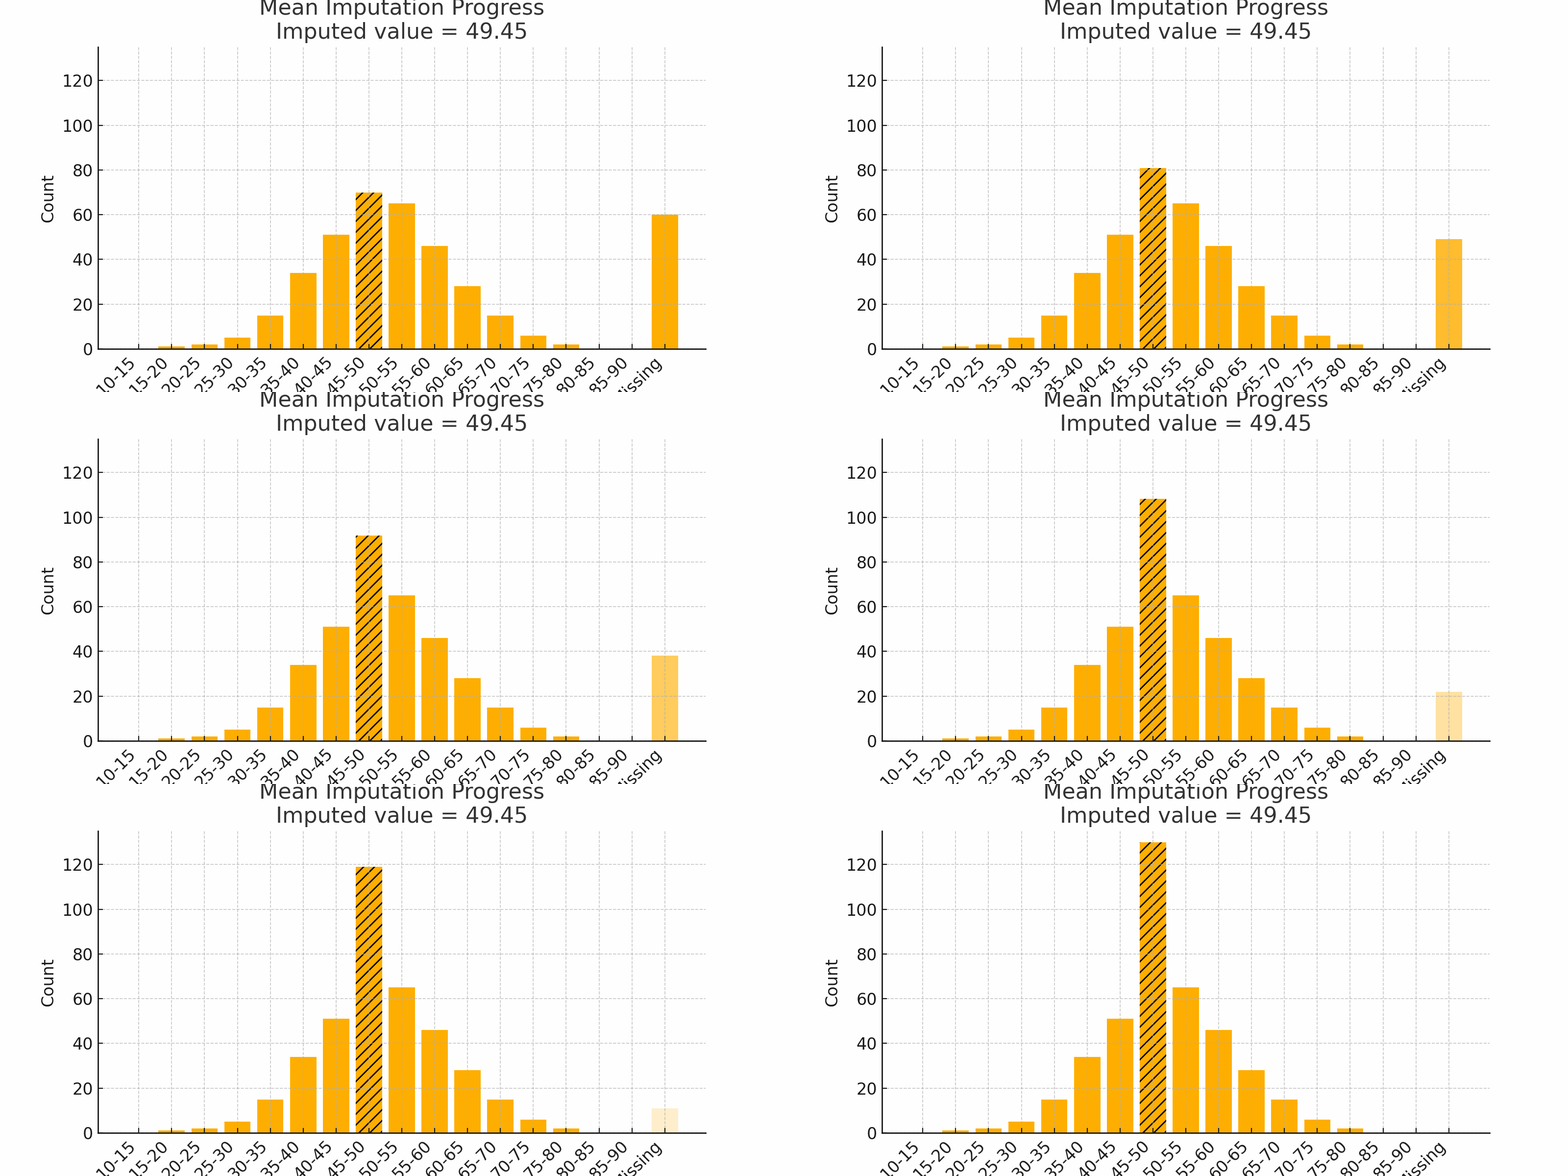
Scenario: You host a dinner for 100 friends and log their ages. Most guests hover around 30 to 40 years old. A handful of birthdays went unrecorded. If you replace each blank with the mean age (say 35), you keep the party’s "average vibe" intact.
Why it works:
- In a normal distribution (bell curve), the mean sits at the center
- It preserves overall average and variance reasonably well
Watch out:
- Outliers (like a toddler or a 90-year-old) can shift the mean
- Filling many blanks with the same number can create an artificial spike

Figure 1: Mean Imputation Progress with bell-shaped distribution
3. Median imputation: the eccentric billionaire
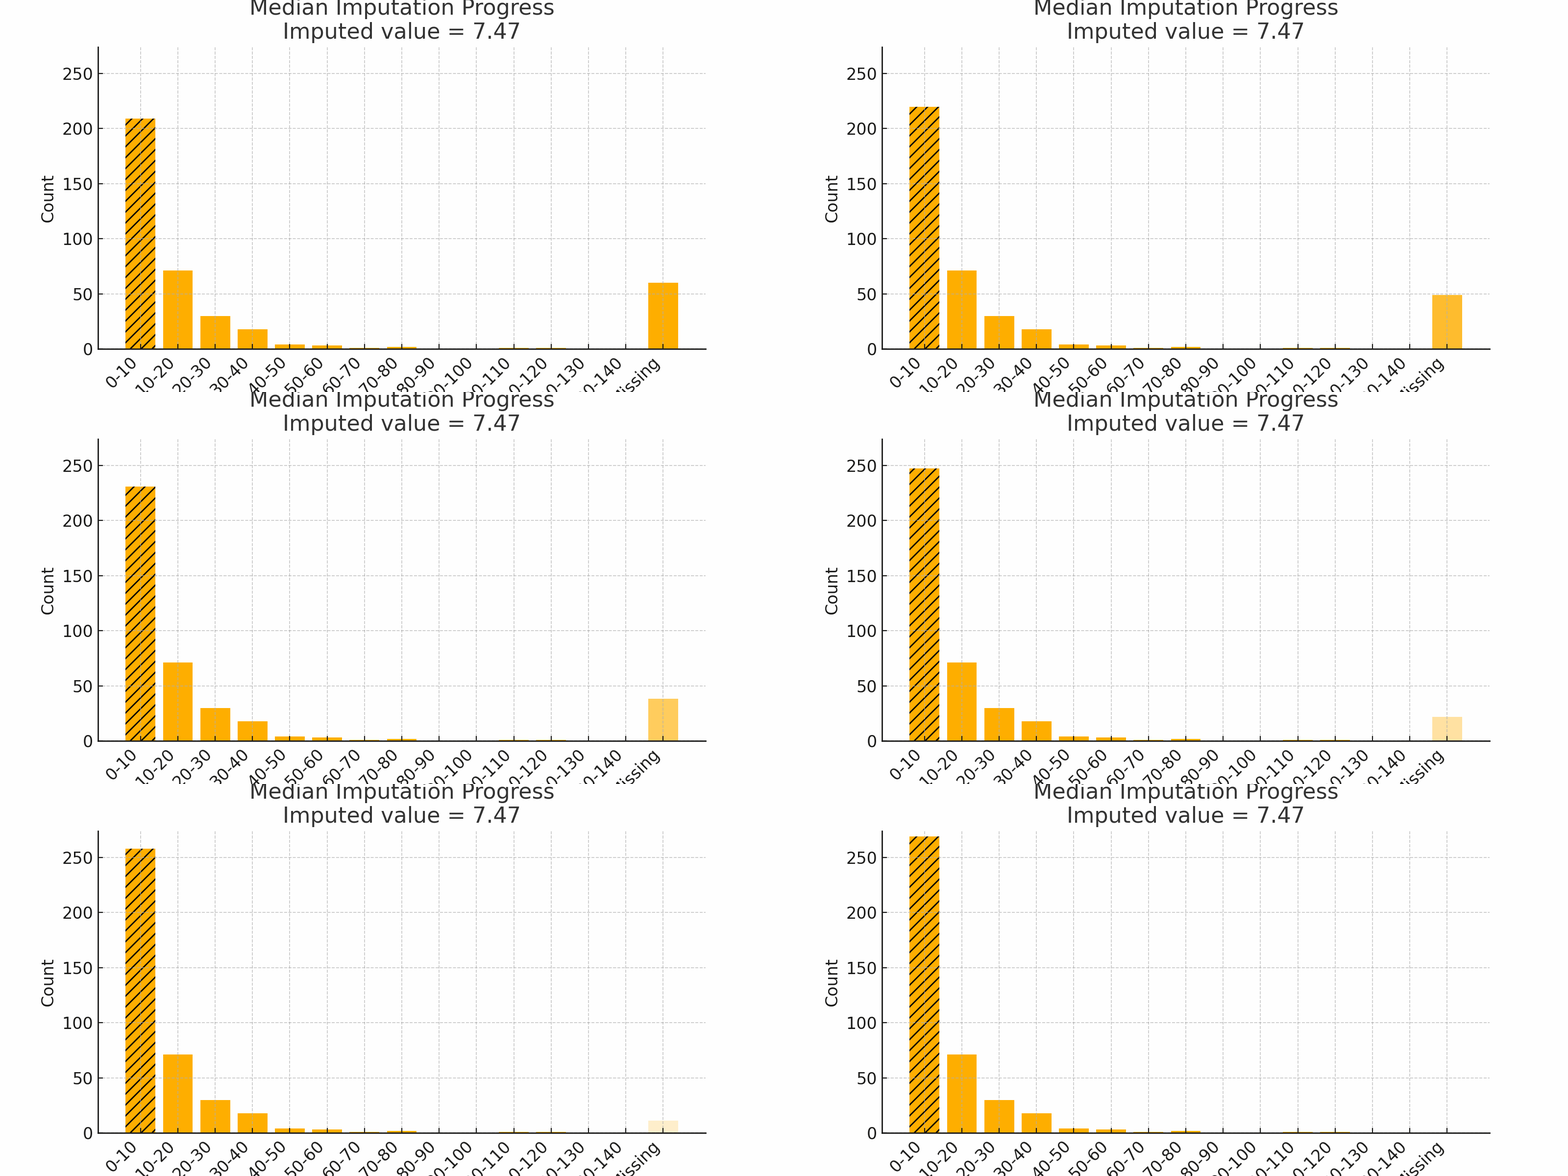
Scenario: Imagine surveying household incomes. Most families earn $50k–$80k, but one billionaire reports $5 billion. A few skipped the question. If you use the mean, the billionaire pulls it way up. Instead, use the median, which lands closer to $60k and reflects most people's reality.
Why it works:
- The median is robust to outliers
- Great for skewed data like income, wait times, or rainfall
Watch out:
- In bimodal distributions, the median might fall where no real value exists

Figure 2: Median Imputation Progress showing skewed values
4. Mode imputation: the popular kid
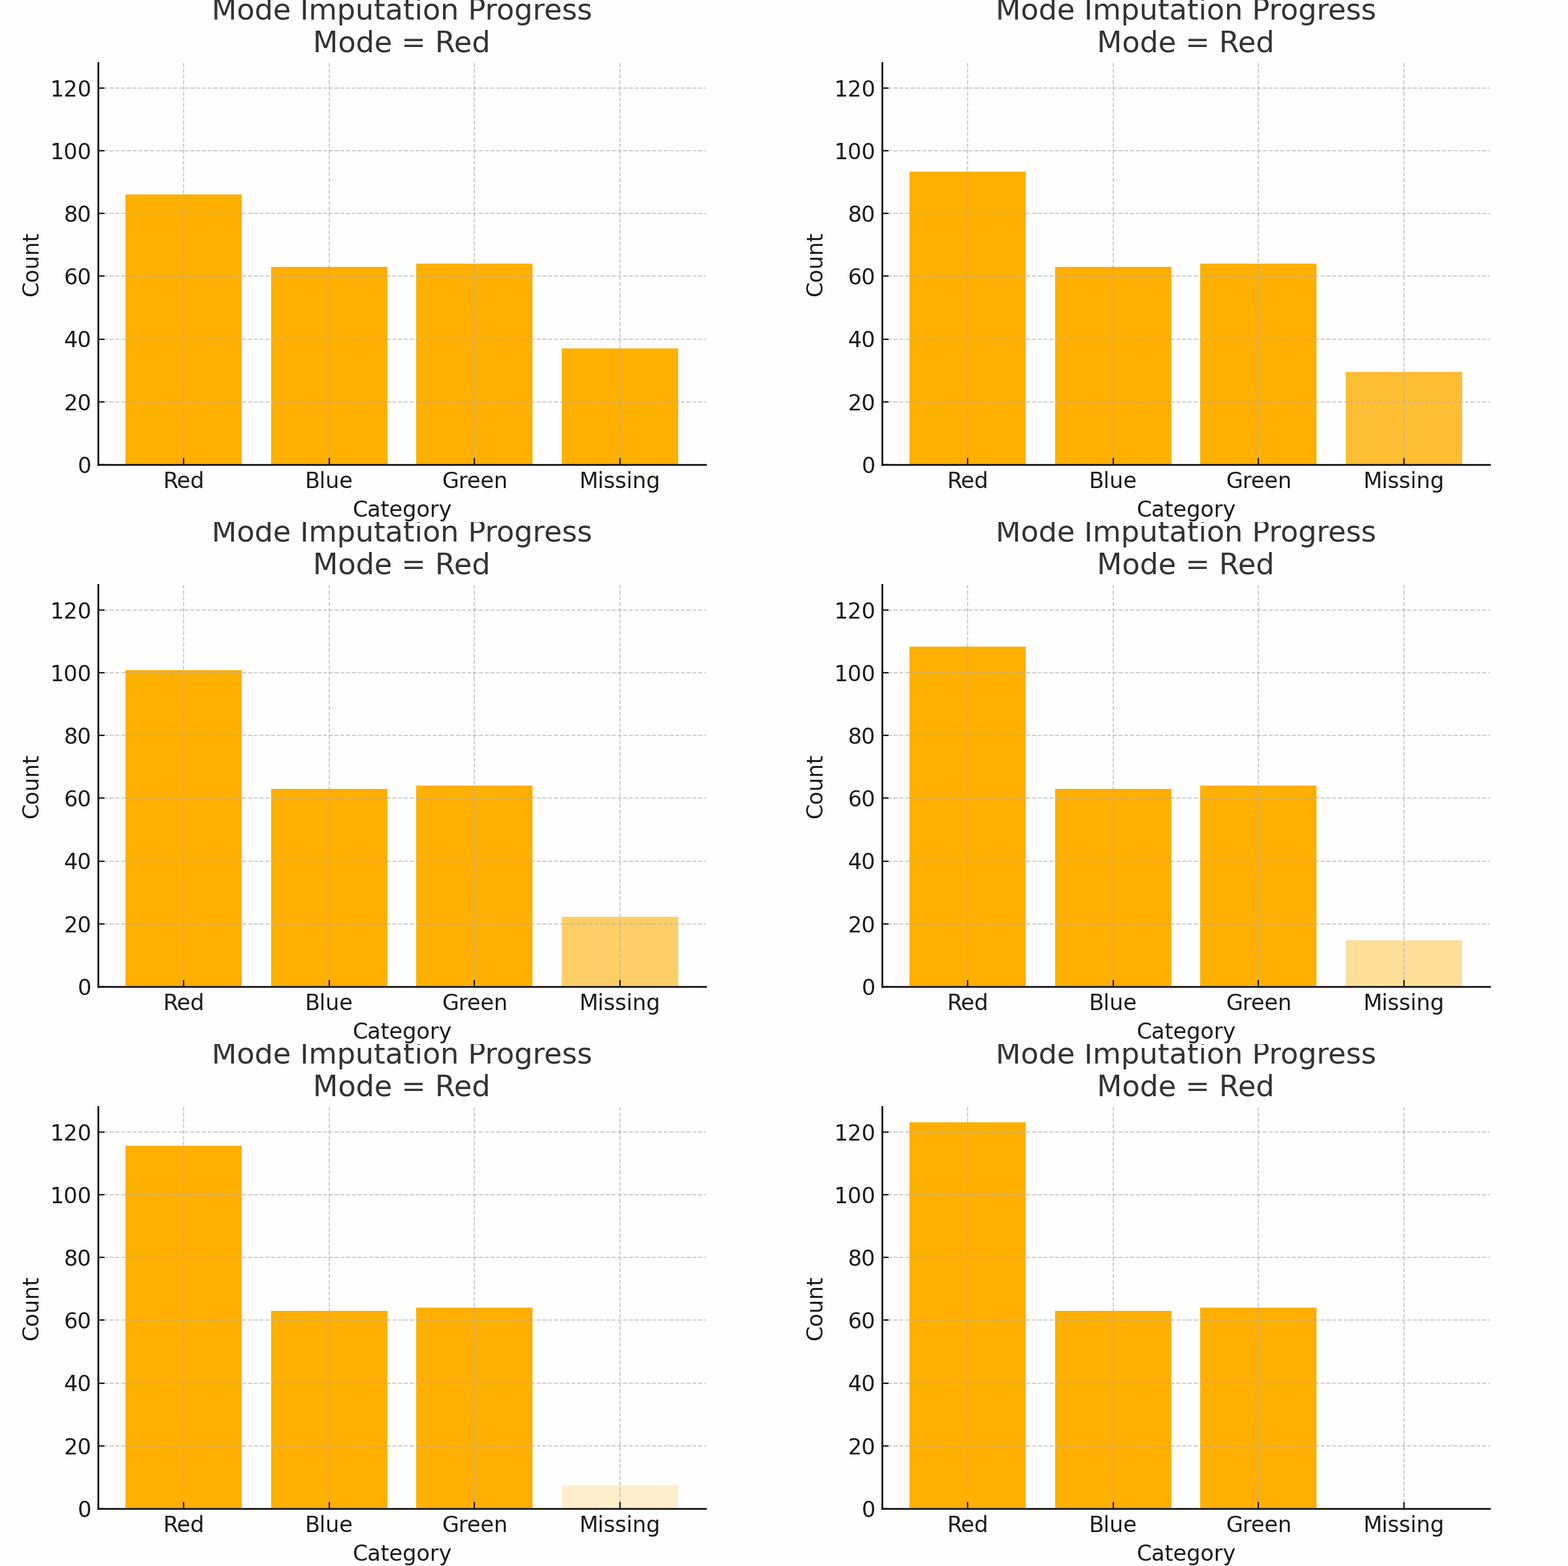
Scenario: You survey people’s favorite T-shirt color: red, blue, or green. Some skip the question. Fill the missing values with the mode, which is the most popular category (say, “red”).
Why it works:
- Mode works well for categorical data with a clear dominant value
Watch out:
- If categories are evenly split, using the mode may exaggerate one group

Figure 3: Mode Imputation Progress on categorical color preferences
5. When to just drop rows
If approx. less than 5-10% of your data is missing, and the missing rows don’t belong to an important subgroup, dropping them can be the cleanest solution. Easiest way to find these "important subgroups" is to do a correlation analysis between features and your target variable(s). Maybe I will write something on this topic later as well.
before, after = df.shape, df.dropna().shape
print("Rows lost:", before[0] - after[0])
Pros: Simple and reliable when data is mostly complete.
Cons: Risk of bias if missingness is not random.
6. Beyond mean, median, mode: advanced strategies
- KNN imputation: Fill blanks based on similar rows
- Iterative regression: Predict missing values using other columns
- Time-series interpolation: Carry forward values or use curves
- Missing flags: Add binary indicator columns for missingness
These methods work better for larger, more structured datasets and can help your models recognize patterns in how and why data is missing.